Measuring Adyen’s Moat

Est. Reading Time: 8-10 Minutes

Continuing on the theme of the Wise post, what follows is another look at the moat of a digital currency processing business, this time in the consumer spending space. The landscape of digital payments is vast, and the total addressable market is enormous. Which, might make for a suitable arena for quality companies to grow unimpeded (or at least reasonably unimpeded) into an inevitable position of dominance.

And, while I do not have an opinion on whether this is a winner take most industry or if it will remain fragmented, finding a few companies that share some “moaty” characteristics, along with prudent management behavior, is a nice way to spread the risk. Should one be interested in the space.

Company Overview

Adyen (ticker in US: ADYEY), is a payment processor focused on the business to consumer (B2C) digital commerce market. This has been a busy space within the last handful of years with the likes of Stripe and Block (formally Square) garnering most of the limelight. Adyen has taken a decidedly different route and arguably has a more compelling business model from a pure execution standpoint.

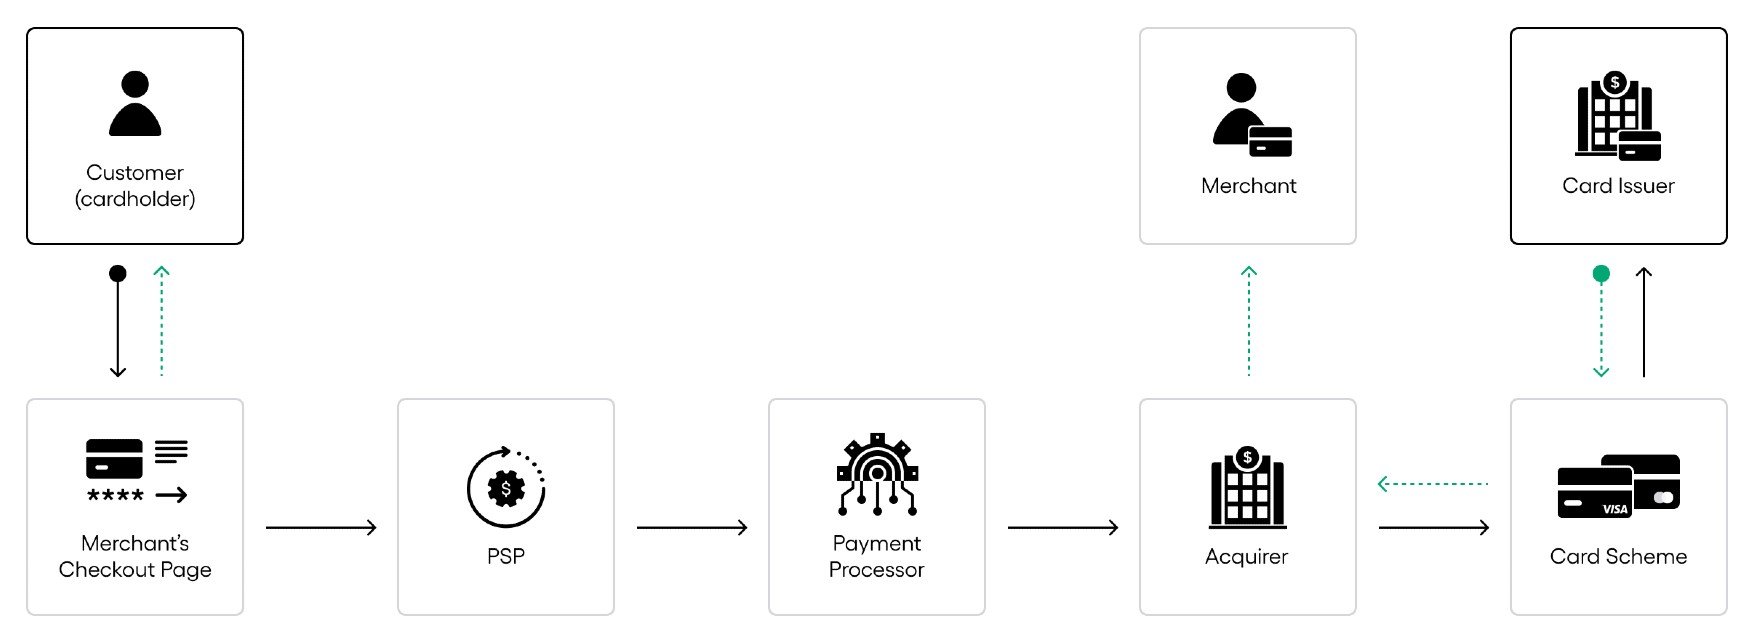
As this is another Robustness Ratio post, only a tertiary exploration of the business is needed and we’ll keep from going down the payment processing rabbit hole. But, to start, an overview of how a customer’s payment is routed and who makes what in terms of fees.

On a purchase of $100, the bank gets the bulk of the consideration via an interchange fee which amounts to roughly $1.50 of this total. The card network, say Visa or Mastercard, will get about $0.30 out of this transaction for their role. Finally, the merchant acquirer, a company like Adyen, makes ~$0.20 for being the interchange of all these parties (including the Customer and Merchant) as well as a processing fee (normally a flat fee) if they are acting as the gateway such as a point-of-sale system.

All these added up are referred to as the Merchant Discount Rate and encompasses what it costs a merchant to accept a digital form of payment.

That is really all the complexity needed to explore a Moat Calculation and business structure/strategy. But, below is a picture for a visual overview.

Adyen is what is known as a full stack solution and this is what differentiates them from the typical merchant acquirer. The standard method of scale in the space has been via acquisitions, each meant to solve a particular piece of the “puzzle” working towards a Rube Goldberg machine of a solution. Adyen, on the other hand, develops everything in house, even their data centers.

The word “adyen” actually means “start again” in Sranan as the founders strongly felt that the space had been built incorrectly from the start.

This organic slow growth has not been the most loved method as of late with the abundance of easy money. But, Adyen’s approach produces a few interesting competitive advantages. First, it makes for a highly accurate product for merchants. Some 20% of online transactions are declined vs. 5% offline (cash/check). If you are a company with $100M of monthly revenue, getting even a 3% improvement on this settlement rate becomes a meaningful boost. Second, their ability to land and expand into a new market is measured in terms of weeks rather than months as is the case for competitors. While good for Adyen, this also equates into several weeks of revenue received sooner for their customers who are looking to expand into new markets. Finally, they also open up all the data to their customers making their customers’ own efforts more efficient.

This is all to foster the foundation of organic growth via their existing customer base. With a churn rate of <1% it would seem this strategy is paying off.

While the competition has gone “down market” and focuses on small to medium businesses, Adyen has been focused on going top down with the likes of eBay and McDonalds. This makes for a much stickier incumbent base of business while they move into smaller merchants as time goes on.

The total market for digital payments is roughly $38T-$40T with Adyen recently processing just $610B of this. With 60% of their business taking place in the EU, 24% in the US, and the rest being in APAC and LATAM they have plenty of head room to see their approach continue to pay off.

It is also worth noting, in stark contrast to the typical Silicon Valley approach of disproportionately rewarding senior mgmt. and VC firms, Adyen is extremely reserved with issuing stock-based compensation.

But, this is about whether they provide benefit to their customers and employees in excess of shareholders, so onto the Robustness Ratio calculation.

On Customers....

This is a bit more nuanced than say the last Robustness Ratio done on Wise. True, both companies are in the digital payments and/or money transfer space but the value propositions are very different. In the case of Wise, you have a customer that is arguably solely focused on the ease of use for the lowest fee possible. In the case of Adyen, there are factors beyond cost that play a part.

Cost is of course always a factor, but for the most part there is not much room to shrink the current fees further. In the transaction outlined above, the total fees equate to about 2% of the merchant’s transaction, with 3/4th of that going to the banks. That is to say that the bulk of the potential reduction is held by a participant that is a markedly different business than the merchant acquirer or card network. So, there is little chance of a merchant acquirer or a Visa ever bothering to become a traditional bank. And likely vice versa. Therefore, we have only the 0.20% of transaction fees to attack in terms of price optimization from the merchant acquirer’s perspective.

For those familiar with Heico, this should be setting off associative alarm bells.

Heico is a provider of specialized airline parts and components. The beauty of their business model is that compared to the overall cost of an airplane, the nuts and bolts (admittedly an oversimplification) are a rounding error. Therefore, a component provider can maintain healthy margins, and pricing power, as long as they continue to deliver because it would be folly to jeopardize the overall system for such a small component. Subsequently, if Heico should double their prices overnight, their customers might complain but they will pay the price.

In reverse order, if you focus on delivering the best-in-class performance for your portion of the dance that is B2C ecommerce, and you are 0.2% of the total transaction, there is little reason to fight on price. A halving of the current fees means little to the customer and it is better to deliver more bang for the buck than to cut price. If the competition cuts pricing by 50%, would you as a company save 0.1% for a system that had even a slightly higher potential to shut down your business in an entire market or region?

So, to evaluate the economic benefit that Adyen provides I settled on utilizing Forrester, a third-party consulting firm that specializes in quantifying the value provided to customers for a wide array of businesses.

The hypothetical inputs were:

Total Annual Sales Volume - $1B

Total Markets the Business is in – 10

Percent of Revenue Outside North America – 50%

Typical Transaction Amount - $50

With this I was able to have a report generated to highlight the expected value Ayden might provide my hypothetical organization.  This report was done in USD while the rest of this analysis is done in Euros.

In typical cost/benefit analysis, Forrester provides multiple years of savings in a NPV approach. Which, although logical, is rarely how internal corporate teams evaluate projects. Having started out in the energy industry for the likes of Halliburton and GE, I’d wager the majority of Adyen’s customers’ go/no-go decision is heavily weighted to the year one benefit and the number of payback months.

On payback, Forrester’s report indicates I’ll make back my investment in less than six months. This is great, but for a layer of conservatism I will only consider my first-year benefit in our Robustness Ratio calculation given the short-term nature of most thinking in the corporate world.

Yes offense, S&P 500 companies.

The efficiency gains of Adyen’s full stack solution are broken into four categories.

 Those are:

Additional revenue retention from multiple payment iterations (closed loop system) – ARR

Improved chargeback write-off rate (the declined payment problem mentioned above) – IC

Improved authorization rates (from direct connection to card networks) – IA

Increased expansion efficiency for new market launches – NML

For a second layer of conservatism, the first three categories are adjusted downward from the report as capitalism is brutal and it is always wise to add a margin of safety to expected returns, even if it is provided by an unbiased third party.

For ARR, expected gains on $1B of revenue were $5,560,000, which was reduced by 40% to $3,336,000.

For IC, expected gains on $1B of revenue were $2,160,000, which was reduced by 40% to $1,296,000.

For IA, expected gains on $1B of revenue were $1,520,000, which was reduced by 15% to $1,292,000. This reduction was less than the previous two categories since this is driven less by the merchant’s business characteristics and more by the operational data of Adyen’s platform.

Finally, a savings of $360,000 per new market expansion was expected due to the increased efficiency of deploying Adyen’s full stack solution. This was viewed both as a wholly ignored benefit and reduced by 50% for the ten markets my hypothetical company wanted to operate within.

In total, when ignoring the benefit of market expansion cost savings, the total value to my hypothetical company was $5,924,000 vs. $3,149,688 in transaction fees and setup costs. And again, this is just for year one.

When considering half of the new market expansion benefit, the total value grew to $7,544,000 vs. the same $3,149,688 in transaction fees and setup costs.  

This gave a customer benefit ratio of 1.88x and 2.40x depending on if the customer gives zero or 50% consideration to the new market expansion benefit, respectively.

As applied to their financials, which is done converting the above into Euros...

On Employees...

Adyen provides a lot of detail into their offices and staffing across their eleven different office location designations. This ranges from their headquarters in Amsterdam to offices in San Francisco, London, Paris, etc.

Their most recent batch of hires was comprised of 60% technology employees, 25% commercial roles and 15% support staff. In evaluating how much they compensate their employees we will assume every single employee is a software engineer and evaluate their compensation spend accordingly. Which, given that no employee has had a +$1M compensation package, founders included, this will skew our numbers in the direction of conservatism

In adding up the average software engineering pay in each of the markets they have an office in, and weighting that to the number of head count they carry, we find that the expected blended market cost of each employee would be €87,224 and €88,281 for 2022 and 2021 respectively. Although this figure includes total package, we will boost this by 20% to €104,669 and €105,937 for another layer of conservatism.

This compares to an average actual total compensation per employee of €138,094 and €122,474 in 2022 and 2021 respectively.

As applied to the financials...
Meaning, that the Employee component of the value add was 1.32x and 1.15x for 2022 and 2021 respectively.

Worth noting, since we like to see restraint on grants, stock comp has been kept under 1.5% of revenue in an era where the average tech company has push that figure above 20%.

On Shareholders...

 Finally, the most straight forward component as it is purely derived from the financials, the Owner Earnings.

Bringing it together...

No consideration for expansion savings...

50% reduction in expansion savings consideration...

Despite all the layers of conservatism here, I believe at least a 50% consideration given to the expansion savings is the more prudent way to look at this calculation. Reason being, 80% of their growth comes from their incumbent customer base’s expansion. Clearly, they are providing some tailwinds to their customers and even if a new customer does not want to consider it, they will certainly benefit from it.

As a final note, if we were to consider the 3-year NPV that was provided in Forrester’s report but was ignored in the Customer section, the Customer multiple jumps to 5.06x while still ignoring the new market expansion benefit. Overall, this would change the no expansion consideration Robustness Ratio to 3.37x and 2.88x for 2022 and 2021, respectively.

Previous
Previous

Pay no Attention to the Man Behind the Curtain

Next
Next

Measuring Wise’s Moat